
The average home gained £5,607 in a year, but a flat lost £3,434. Semis rose fastest, and the borough is still £13,107 below its December 2022 peak.
The average home in Tonbridge and Malling sold for £407,880 in July, £5,607 more than in July last year. A flat sold for £3,434 less.
That is the July reading of the Land Registry’s UK House Price Index, published on 16 September. The borough average rose 0.7% on the month and 1.4% on the year. (HM Land Registry)
One number worth carrying around: the borough’s average is still £13,107 below its peak. That peak was £420,987, set in December 2022, three years and seven months ago.
Flats are the only type worth less than a year ago
Split the borough by property type and the market divides cleanly in two.
| Type | July 2025 | July 2026 | Change |
|---|---|---|---|
| Detached | £687,989 | £694,607 | +1.0% |
| Semi-detached | £415,462 | £426,111 | +2.6% |
| Terraced | £338,069 | £344,495 | +1.9% |
| Flat | £226,158 | £222,724 | -1.5% |
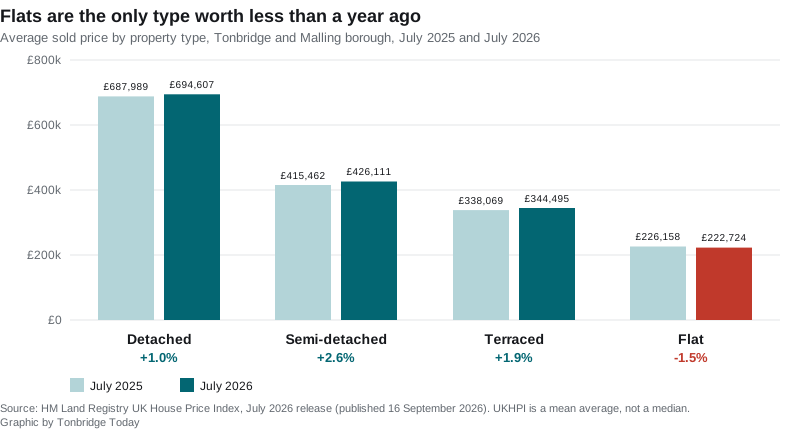
The semi-detached home is doing the work. At +2.6% it is rising nearly twice as fast as the borough average, and it is the type most first-time movers in this borough buy.
The flat market is the counterweight. A flat here now costs less than it did in July 2025, less than in August 2025, and less than in December 2025. That matters more than the size of the fall, because flats are where most people in the borough start.
The first-time buyer average is £326,581, up £5,309 on the year.
Where the borough sits in Kent
Tonbridge and Malling is the third dearest of Kent’s thirteen local authority areas, behind Sevenoaks on £538,714 and Tunbridge Wells on £456,227. The Kent average is £346,904.
On the month, the borough’s 0.7% rise put it in the upper half of the county. Tunbridge Wells rose 1.7%, Dover 1.4% and Medway 1.0%. Sevenoaks fell 1.4%, the steepest drop in Kent, and Folkestone and Hythe fell 0.8%.
On the year the county picture turns around. The strongest annual growth is in the cheaper half of Kent: Gravesham +3.3%, Swale +3.2%, Canterbury +2.9% and Dover +2.7%. Tonbridge and Malling’s +1.4% sits mid-table. Only two Kent areas fell over the year, Dartford by 2.0% and Maidstone by 0.1%.
Set against the wider picture, the borough is doing well on one comparison and unremarkably on another:
- South East region: +0.2% on the year. The borough is growing seven times faster than the region it sits in.
- England: +1.1%. United Kingdom: +1.4%. On those the borough is ordinary.
- Nationally, Tonbridge and Malling’s annual change ranks 134th of the 295 English local authority districts, counting up from the steepest fall. 85 of those 295 districts are worth less than a year ago. This borough is not one of them.
Two things to know before you use these numbers
UKHPI is a mean average, not a median. It is pulled up by the borough’s expensive detached stock, so it is higher than the price most people in Tonbridge and Malling actually pay. Treat it as a measure of direction rather than as “what a house costs here”.
The most recent months get revised. June was first published at £405,932 with an annual change of +2.6%. In this release it is restated at £404,851 and +2.3%. The Land Registry keeps adding completed sales to a month after publishing it, so the newest figure in any release is provisional. We flag these rather than quietly restating them.
Sales volumes lag further still. They are blank for June and July, because those months are incomplete. The most recent published figure is 99 sales in May 2026, against 132 in May 2025. Volumes across the spring were low throughout: 108 in April, 127 in March, 110 in February.
What it means for you
If you are selling a house, the market is moving your way but slowly, and the gains are in houses rather than flats. A semi-detached home is worth about £10,600 more than a year ago.
If you are selling a flat, the year has gone against you, by about £3,400. There is no sign of that turning in the monthly numbers yet.
If you are buying your first home, the £326,581 average is up £5,309 in a year, or about £440 a month of price growth to outrun. The cheapest medians in the borough are at its northern edge: £292,500 in the ME1 postcodes covering Burham and Wouldham, and £310,000 in ME6 around Snodland. Tonbridge town centre and south (TN9) sits at £380,000 and ME19, covering West Malling and Kings Hill, at £470,000. Those are medians of sales completed between June 2025 and June 2026, set out on our Tonbridge house prices page.
If you are checking your own street, the borough average is close to useless. Land Registry publishes every completed sale by postcode, and our own Tonbridge house prices page breaks the borough down by area.
The August index is due in October.
Related
- Tonbridge house prices, area by area: median sold prices by postcode across the borough.
- Tonbridge and Malling claimant count hits 2,095: the jobs data published the same week.
- Tonbridge council tax bands: what each band costs this year.
- Tonbridge planning news: the Local Plan and the housing numbers behind it.
Sources
- HM Land Registry, UK House Price Index for July 2026, published 16 September 2026.
- UK HPI full file, July 2026 release, for Tonbridge and Malling (E07000115), the other twelve Kent areas, the South East, England and the United Kingdom, and for the property-type, first-time buyer and sales-volume figures.
- UK HPI full file, June 2026 release, for the June figure as first published, against which the revision is measured.
- UK House Price Index browser, Tonbridge and Malling.
Have your say