
The borough average was £406,706 in September, up £6,108 on a year, while Kent fell 0.3%. Semis rose 2.7%, and flats are worth less than a year ago.
House prices in Tonbridge and Malling rose over the past year while the Kent average fell. The average home in the borough was £406,706 in September. That is £6,108 more than in September 2025, a rise of 1.5%.
The figures come from HM Land Registry’s UK House Price Index. The September index was published on 18 November and is the latest available.
Overview
- Average price, September 2026: £406,706, up 1.5% on the year
- The month: down 0.2% from August’s £407,474
- Kent: the county average fell 0.3%, and six of Kent’s 13 council areas are lower than a year ago
- Flats: the only property type worth less than in September 2025, down 1.2%
Third fastest rise in Kent
Only two Kent council areas rose faster over the year: Canterbury and Gravesham. At the other end, Dartford fell 5.8%.
| Area | Average, September 2026 | Change on the year |
|---|---|---|
| Canterbury | £345,166 | +2.8% |
| Gravesham | £347,807 | +2.3% |
| Tonbridge and Malling | £406,706 | +1.5% |
| Swale | £293,546 | +1.4% |
| Tunbridge Wells | £453,812 | +0.7% |
| Medway | £296,831 | +0.7% |
| Maidstone | £352,666 | +0.2% |
| Dover | £282,507 | -0.5% |
| Ashford | £344,795 | -0.7% |
| Sevenoaks | £531,380 | -1.3% |
| Folkestone and Hythe | £305,251 | -2.1% |
| Thanet | £263,112 | -3.0% |
| Dartford | £338,982 | -5.8% |
Each figure comes from the same index for Kent and its council areas.
On price, the borough is still the third dearest part of Kent, behind Sevenoaks and Tunbridge Wells. The Kent average is £345,603, so a typical home here costs about £61,000 more than the county average.
Against the wider picture:
- South East: £378,915, down 0.2% on the year
- England: £292,998, up 0.8%
- United Kingdom: £272,642, up 1.2%
Semis rose most, flats fell
The split by property type has the same shape as in the summer. Houses gained and flats lost.
| Type | September 2025 | September 2026 | Change |
|---|---|---|---|
| Detached | £683,376 | £692,594 | +£9,218 (+1.3%) |
| Semi-detached | £414,334 | £425,606 | +£11,272 (+2.7%) |
| Terraced | £337,541 | £343,423 | +£5,882 (+1.7%) |
| Flat or maisonette | £224,185 | £221,512 | -£2,673 (-1.2%) |
The first-time buyer average was £325,536, up £5,551 on the year.
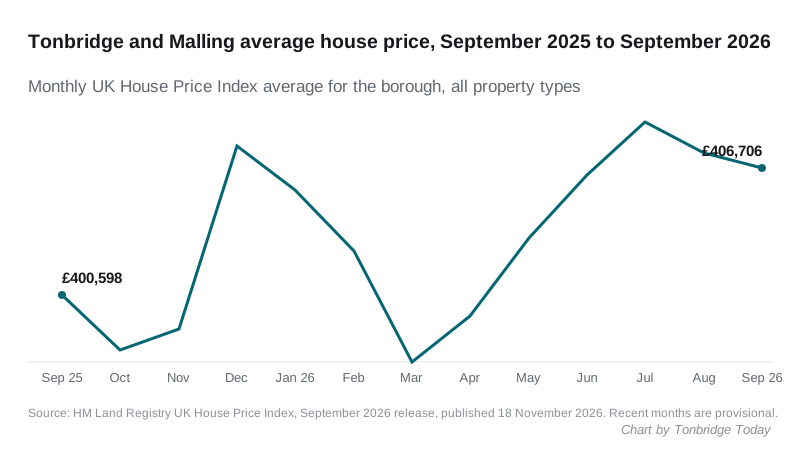
The year was not a straight climb. The average fell to £397,367 in March, its lowest point of the period, then rose for four months to £408,961 in July. August and September both edged down.
The borough is still £14,281 below its peak of £420,987, set in December 2022.
Two things to know before you use these numbers
UKHPI is a mean average, not a median. The borough’s expensive detached homes pull it up, so it is higher than the price most buyers here actually pay. Treat it as a measure of direction.
Recent months get revised. When we reported the July figures, the index put July at £407,880, up 1.4% on the year. It now reads £408,961, up 1.7%. The Land Registry keeps adding completed sales to a month after first publishing it, so September’s figure is provisional too.
Sales counts lag further. The latest is 129 sales in July 2026, against 187 in September 2025.
What it means for you
If you are selling a house, prices are higher than a year ago, and Tonbridge and Malling is doing better than most of Kent. A semi-detached home is worth about £11,300 more than in September 2025.
If you are selling a flat, the year has gone the other way by about £2,700. The flat average has been lower than a year earlier in eight of the nine months so far this year.
If you are buying your first home, the £325,536 first-time buyer average is about £5,500 higher than a year ago. Prices vary widely across the borough, and the cheapest postcodes are at its northern edge, around Snodland and Burham. Median sold prices for each postcode area are on our Tonbridge house prices page.
The October index is due in December.
Sources
- HM Land Registry, UK House Price Index for September 2026, published 18 November 2026.
- UKHPI open data, Tonbridge and Malling, September 2026, with the matching records for the other twelve Kent council areas, Kent, the South East, England and the United Kingdom.
- UK House Price Index browser, Tonbridge and Malling, for the monthly series in the chart.
Have your say